


Common Types of Diagrams
Diagram is effective way to convey complexity through visualisation process.

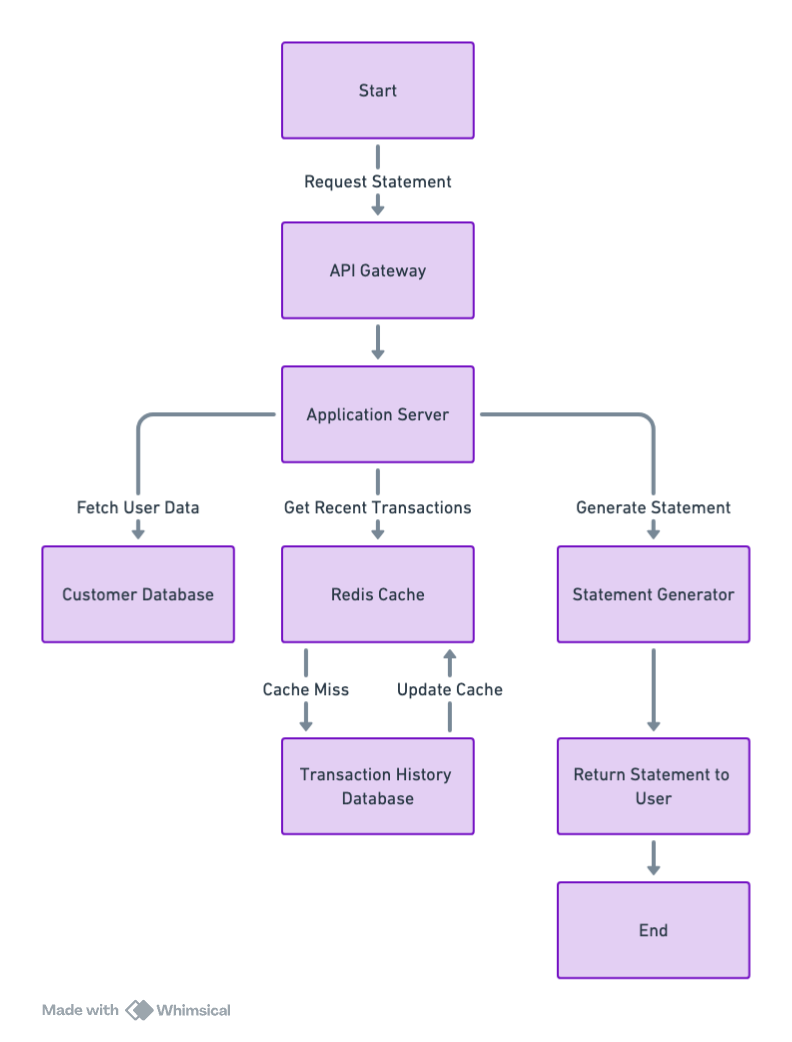
Boxes and arrows
Box and arrow diagrams depict a flow from one item to the next.
Boxes represent the components or entities in your architecture. These could be application components such as APIs or microservices.
Arrows indicate the direction of data flow, control flow or interaction between these components. For example an arrow between two services could indicate an API call or communication between them.
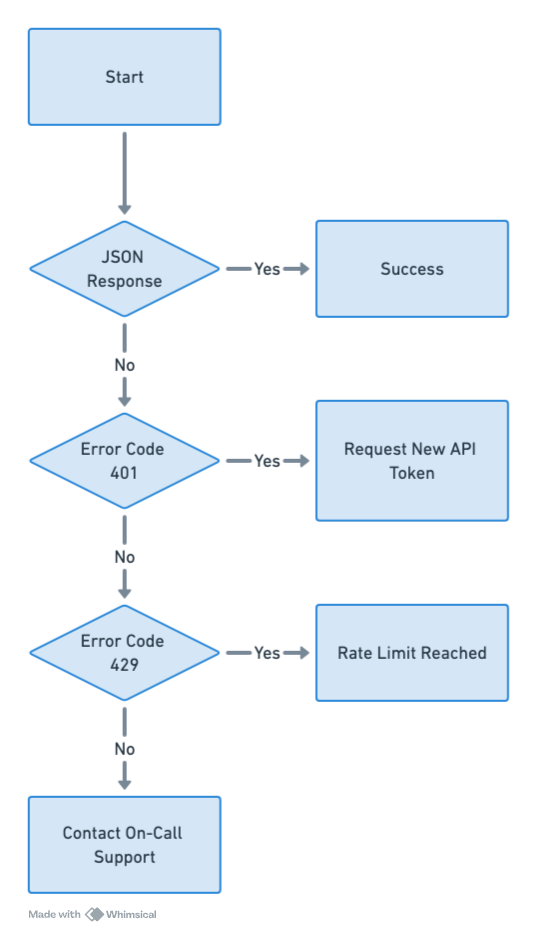
Flowcharts
Flowcharts guide a user from a start to a finish point. Flowcharts are commonly used to visualise sequential process, decision tree or automated workflow.
Start/End points are often presented by ovals or rounded rectangles.
Processes such as tasks, actions, or operations are represented by rectangles.
Decision points where yes/no or true/false are depicted by diamonds.
Arrows connects these shapes, showing the direction or flow from one step to the next.
Swimlanes
Swimlane diagrams are an enhanced form of flowcharts, where the lanes (horizontal and vertical) represent different actors, departments or systems involved in a process. They help break down complex workflows by clearing showing which part of the process is handled by whom, making them especially useful when there are multiple contributors or interacting systems.
Lanes: Each lane corresponds to a participant or system involved in a process.
Flow: The process moves from the start to the end, just like in a standard flowchart, but within lanes, showing which participant is responsible for each action.
Transitions: Arrows are used to indicate the flow of actions between lanes, visualising how different participants interact at various stages of the process.

Summary
Boxes and Arrows: Showing relationships or data flow between entities.
Flowcharts: Best for visualising linear processes with clear start and end points.
Swimlanes: Processes involving multiple participants or systems where responsibilities are shared.